A Better Way To Trade Fibonacci Retracements

What Is the Fibonacci Retracement Tool?
When it comes to simple yet effective trading techniques, the Fibonacci retracement to tool is one of the most popular technical helpers. Used by newbies and pros alike, the Fibonacci retracement tool continues to be one of the most reliable options for helping traders establish entry points to the market. Essentially, when using the tool, the trader will map a price move (either from top to bottom for a bearish move or bottom to top for a bullish move), the tool will then automatically plot price levels within that move which correspond to certain retracement levels. The percentages (retracement levels) themselves are based on the Fibonacci number sequence and can identify powerful reversal points.
Great For Trend Trading
The beauty of the tool is that it is particularly helpful for gaining entry during corrections within trending market. For example, if price is selling off and then corrects higher, the Fibonacci retracement tool will highlight potential resistance levels which can be used as locations to sell, anticipating the continuation of the bearish trend. On the other hand, if the market is moving higher and then corrects lower, the tool will highlight potential support levels which can be used as locations to buy, anticipating the continuation of the bullish trend.
Which Levels To Use?
The issue that most new traders have with the Fibonacci retracement tool, however, is that they struggle to know “which level to use”. Given that the tool automatically plots a range of levels there is a lot of discussion around which levels are “best” and any quick internet search will throw up thousands of unhelpful answers. However, over the years I’ve learned that the most effective way to trade the Fibonacci retracement levels is through combining them with some simple candlestick reading.
Many new traders start out by looking to trade the market as it tests each Fibonacci level, a recipe for swift disaster. A much better way to improve your chances of success is to look to identify reversal candlesticks at key levels and establishing technical confluence. Doing this adds a valuable extra level of confirmation to any trade you place. Let’s look at some examples below.
Fibonacci Levels With Candlestick Confirmation
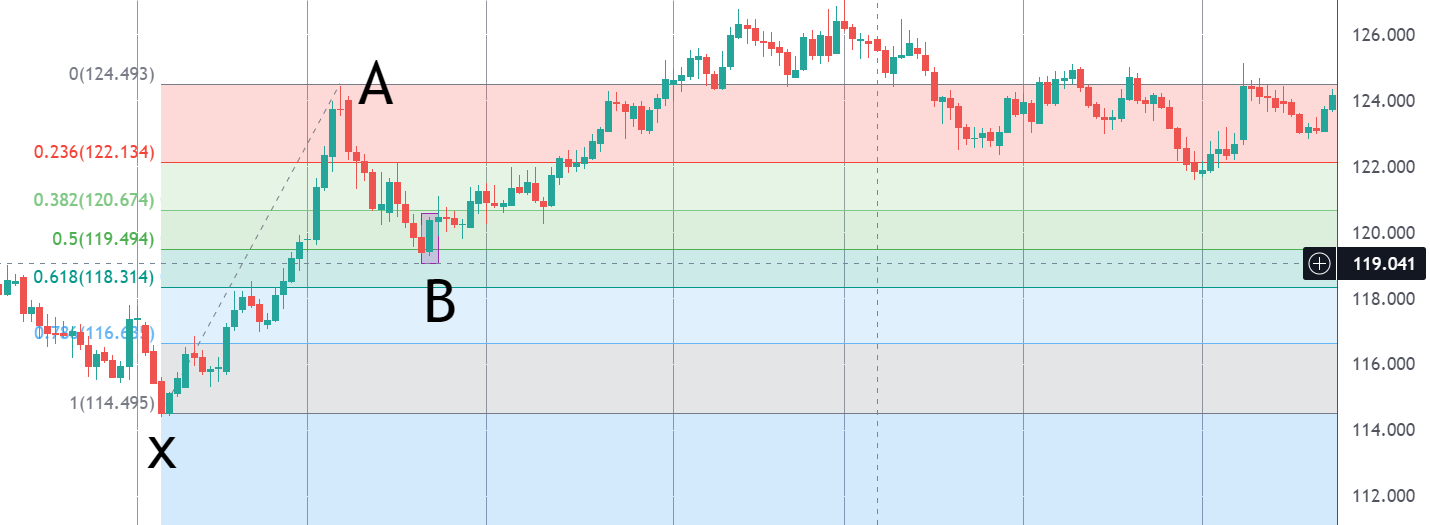
In the image above you can see price is trending higherinitially, allowing us to apply our Fibonacci retracement tool from X – A as pricebegins to correct. Notice how price blows through the first two levels, the23.6% and 38.2% retracement. However, as price tests the 50% retracement you’llnotice that we get a large bullish engulfing candle (highlighted) which is astrong bullish reversal signal, allowing us to place our buy trade. From thatpoint (X) you can see that the bull trend continues and price trades higher.
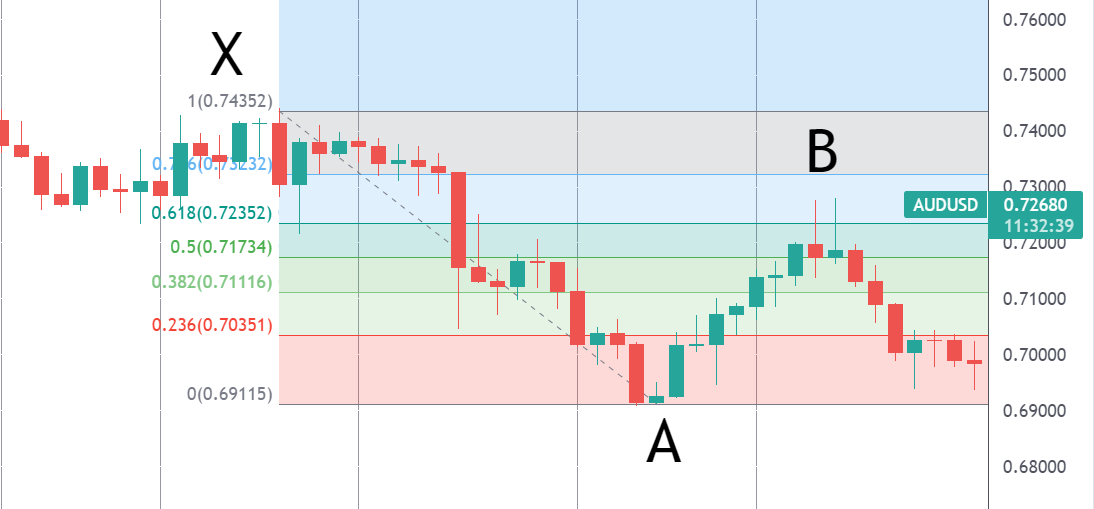
In the image above we can see price is trending lower initially, allowing us to apply our Fibonacci retracement tool from point X to point A as the market starts to correct higher. Notice how the market blows through three key levels (23.6%, 38.2% and the 50%) before hitting the 61.8% level and forming a tweezer top (pair of bearish pin bars highlighted). At this point, we have our bearish reversal signal and can place a sell trade.
Final Thoughts
So, hopefully by now you can see how valuable it is to add in a little extra confirmation to your trading and how some simple candlestick reading can boost your chances of success with Fibonacci trading. We’ve looked at just a couple of examples here, but any solid reversal candle will work in the same way so spend some time testing different candles out to see which works best for you.
Disclaimer: The material provided is for information purposes only and should not be considered as investment advice. The views, information, or opinions expressed in the text belong solely to the author, and not to the author’s employer, organization, committee or other group or individual or company.
Past performance is not indicative of future results.
High Risk Warning: CFDs are complex instruments and come with a high risk of losing money rapidly due to leverage. 69% and 73% of retail investor accounts lose money when trading CFDs with Tickmill UK Ltd and Tickmill Europe Ltd respectively. You should consider whether you understand how CFDs work and whether you can afford to take the high risk of losing your money.
Futures and Options: Trading futures and options on margin carries a high degree of risk and may result in losses exceeding your initial investment. These products are not suitable for all investors. Ensure you fully understand the risks and take appropriate care to manage your risk.
With 10 years of experience as a private trader and professional market analyst under his belt, James has carved out an impressive industry reputation. Able to both dissect and explain the key fundamental developments in the market, he communicates their importance and relevance in a succinct and straight forward manner.