Gold Analysis: Potential Jump Ahead?

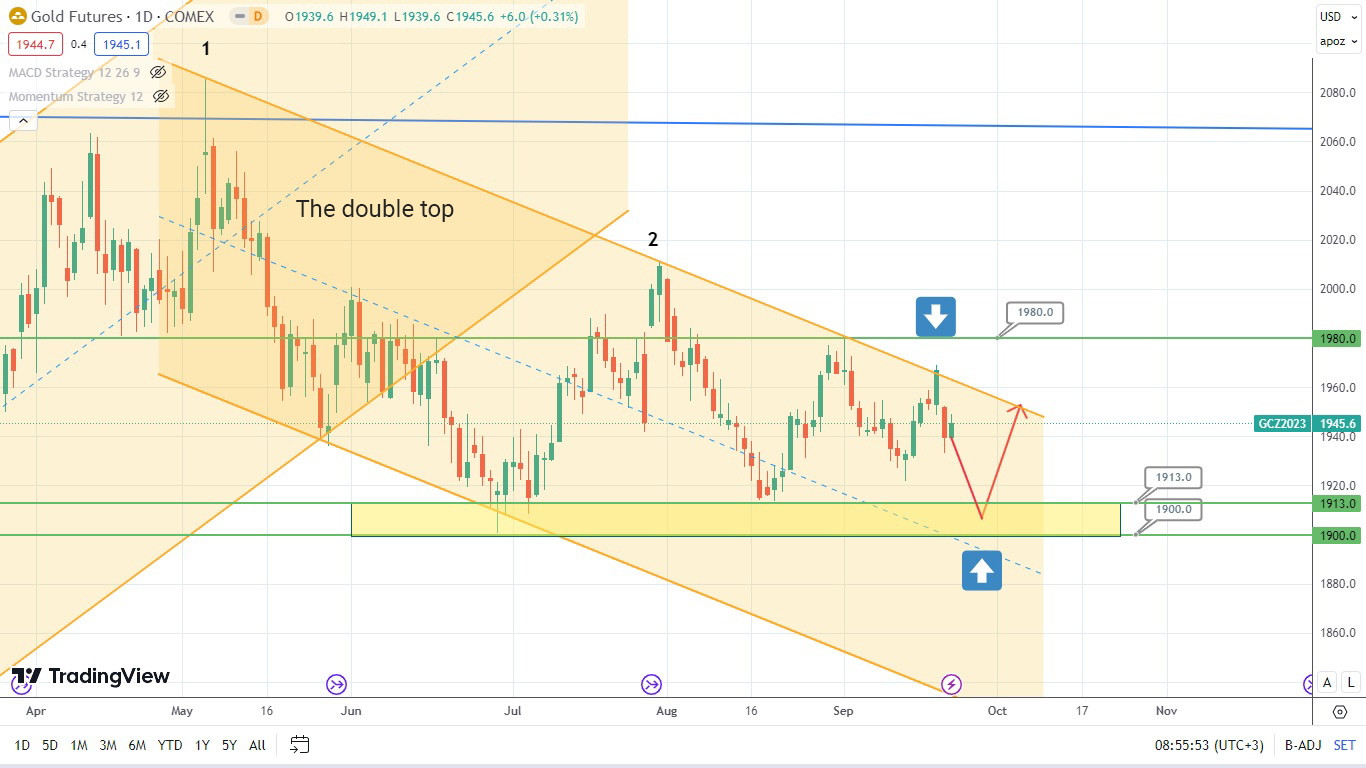
Gold rebounded from the downtrend. Currently, it is trying to enter the supporting zone formed between levels 1900 and 1913. The asset’s price is likely to test this zone, rebound, and jump to break the downtrend and test the resistance level of 1980.
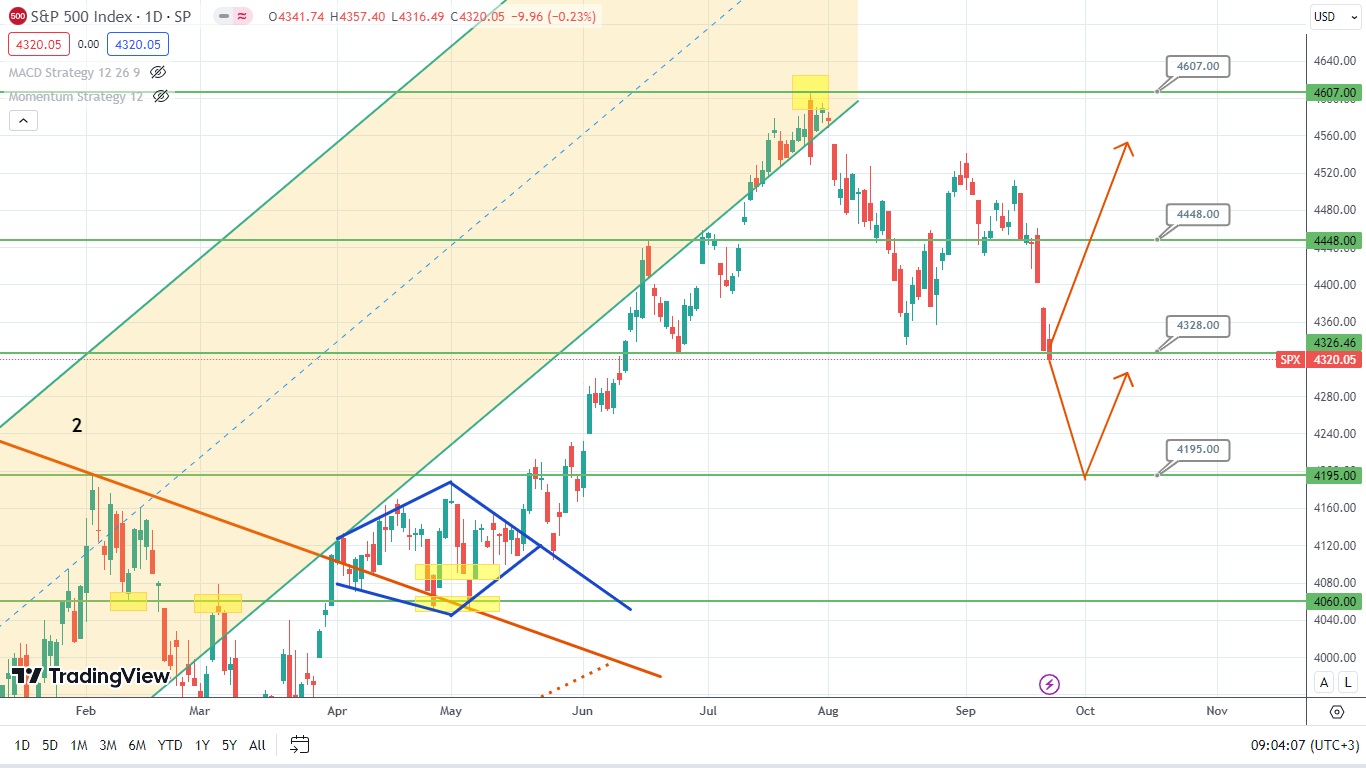
American stock index S&P500 is now testing the supporting level of 4328. The asset’s price might potentially either rebound or break the support and drop. The index might also break the support and form the double top. Hence, keep an eye on the price movements or candlestick formations next to this important level.
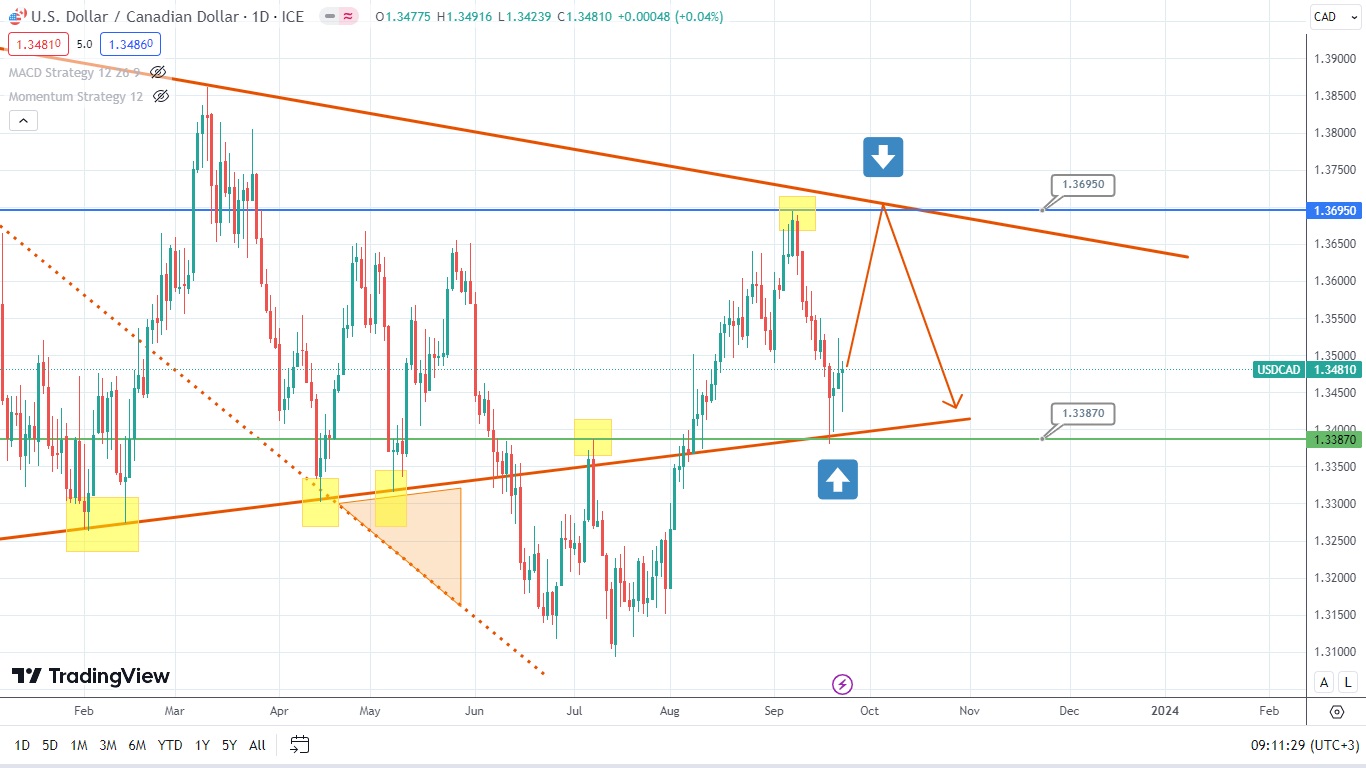
The Canadian dollar rebounded from the supporting level of 1.3387. The price of this asset might have to face resistance at the level of 1.3695, which is located next to the weekly downtrend, and rebound.
Disclaimer: The material provided is for information purposes only and should not be considered as investment advice. The views, information, or opinions expressed in the text belong solely to the author, and not to the author’s employer, organization, committee or other group or individual or company.
Past performance is not indicative of future results.
High Risk Warning: CFDs are complex instruments and come with a high risk of losing money rapidly due to leverage. 69% and 73% of retail investor accounts lose money when trading CFDs with Tickmill UK Ltd and Tickmill Europe Ltd respectively. You should consider whether you understand how CFDs work and whether you can afford to take the high risk of losing your money.
Futures and Options: Trading futures and options on margin carries a high degree of risk and may result in losses exceeding your initial investment. These products are not suitable for all investors. Ensure you fully understand the risks and take appropriate care to manage your risk.