Institutional Insights: Goldman Sachs SP500 Positioning & Key Levels

Institutional Insights: Goldman Sachs SP500 Positioning & Key Levels
SP500 Positioning metrics & key levels according to Goldman Sachs
Summary:
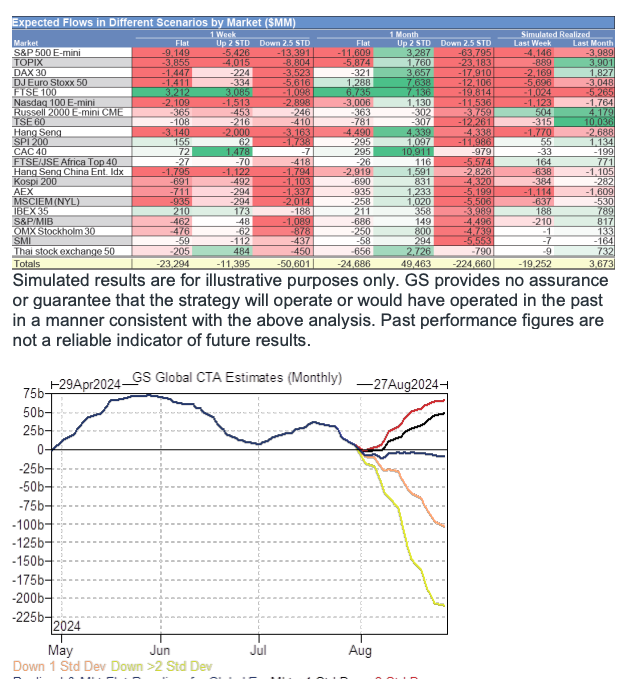
1. CTA Corner: We have CTAs modelled long $130bn of global equities
(84th %tile) after selling $19bn of equities last week globally (link).
2. GS PB: The GS Equity Fundamental L/S Performance Estimate fell -
0.67% between 7/19 and 7/25 (vs MSCI World TR -2.47%), driven
entirely by beta of - 1.29%, as alpha finished positive (+0.62%) on the
back of long side gains. The GS Equity Systematic L/S Performance
Estimate rose +1.25% during the same period, driven by alpha of
+1.10% from long side gains and beta of +0.14% (link).
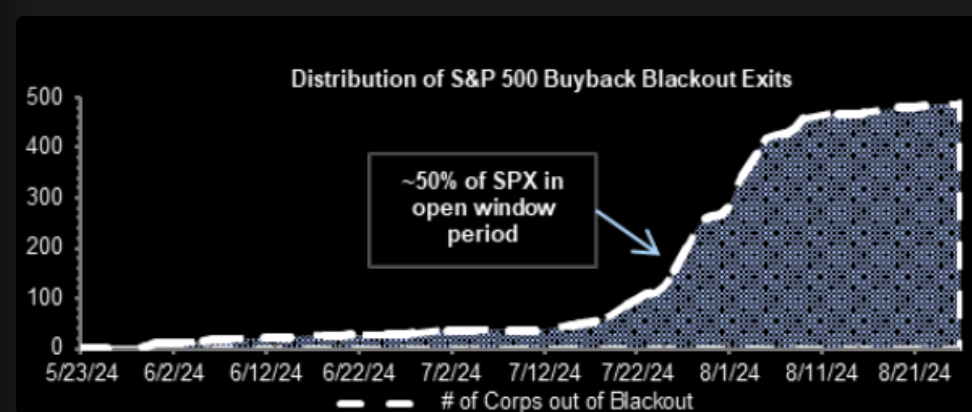
3. Buybacks: We estimate this open window will run through 9/6. At the
moment, we see ~50% of corporates in open window with ~66% in
open window by the end of the week
CTA Corner
CTA Flows:
• Over the next 1 week…
o Flat tape: -$23bn to sell (-$9bn SPX to sell)
o Up tape: -$11bn to sell (-$5bn SPX to sell)
o Down tape: -$51bn to sell (-$13bn SPX to sell)
• Over the next 1 month…
o Flat tape: -$25bn to sell (-$12bn SPX to sell)
o Up tape: +$49bn to buy (+$3bn SPX to buy)
o Down tape: -$225bn to sell (-$64bn SPX to sell)
• Key pivot levels for SPX:
o Short term: 5475
o Med term: 5232
o Long term: 4818
Disclaimer: The material provided is for information purposes only and should not be considered as investment advice. The views, information, or opinions expressed in the text belong solely to the author, and not to the author’s employer, organization, committee or other group or individual or company.
Past performance is not indicative of future results.
High Risk Warning: CFDs are complex instruments and come with a high risk of losing money rapidly due to leverage. 71% and 74% of retail investor accounts lose money when trading CFDs with Tickmill UK Ltd and Tickmill Europe Ltd respectively. You should consider whether you understand how CFDs work and whether you can afford to take the high risk of losing your money.
Futures and Options: Trading futures and options on margin carries a high degree of risk and may result in losses exceeding your initial investment. These products are not suitable for all investors. Ensure you fully understand the risks and take appropriate care to manage your risk.
Patrick has been involved in the financial markets for well over a decade as a self-educated professional trader and money manager. Flitting between the roles of market commentator, analyst and mentor, Patrick has improved the technical skills and psychological stance of literally hundreds of traders – coaching them to become savvy market operators!