Institutional Insights: Goldman Sachs S&P500 Trading Desk Roadmap

S&P Roadmap — Higher in August, Choppy Sept/Oct, Final Push Into Year-End
The path of least resistance for the S&P remains higher in August, but September and October should be choppier as supply, seasonals, and midterm-related uncertainty rise. That choppiness then sets up a final year-end push, assuming earnings resilience holds and the AI capex cycle does not break credit or rates markets.
The bullish case is not simply “Tech up.” It is broader than that:
earnings breadth is improving
the rally has broadened without killing Tech
hedge-fund risk posture has reset
CPI did not deliver a hawkish shock
Fed hike odds have eased
AI capex remains a powerful earnings and credit-issuance driver
CTAs are no longer an immediate equity headwind
gold and Japan add diversification channels
small caps have already participated, though future upside may be more limited
The main tension is that the same AI capex cycle supporting earnings and infrastructure demand is also increasing duration supply, real-rate pressure, and financing complexity.
1. August: Path of Least Resistance Higher
The near-term case for August upside is strong because the market has passed several important tests:
Q2 earnings have been better and broader than expected.
CPI lowered core PCE tracking.
September hike odds are down to roughly 38%.
Vol has compressed after the event.
Hedge-fund exposure is no longer stretched.
CTA equity selling triggers are further away.
QQQ / NDX upside structures are being implemented again.
S&P is consolidating near breakout levels rather than breaking down.
In short:
Cleaner Positioning+Better Earnings Breadth+Benign CPI+Low Vol=August Upside BiasCleaner Positioning+Better Earnings Breadth+Benign CPI+Low Vol=August Upside Bias
The immediate ES/SPX tactical roadmap still looks like:
7800→7820→7845→78937800→7820→7845→7893
provided 7751 holds / is reclaimed and 7800 is accepted above.
2. Q2 Earnings: Breadth Is the Key Feature
The most important earnings statistic is not just the headline EPS growth number. It is the breadth.
Key stats:
9 of 11 sectors generated double-digit YoY EPS growth.
The median stock grew earnings by 14% YoY.
That is the strongest median EPS growth since the 2021 reopening.
That matters because earlier concentration concerns required one thing to improve:
earnings growth needed to broaden.
And it has.
This is the strongest argument that the rally is broadening through catch-up, not catch-down.
3. Broadening Has Not Come at Tech’s Expense
This is a critical nuance.
The market is broadening, but Tech has not collapsed.
Tech is still the second-best performing sector YTD, up around 23%.
Meanwhile:
every headline sector is positive YTD
roughly half of sectors have double-digit total returns
equal-weight S&P is up roughly 16% YTD
That is a healthy form of broadening.
The best broadening is not:
Tech Down+Everything Else UpTech Down+Everything Else Up
It is:
Tech Still Up+Everything Else Catching UpTech Still Up+Everything Else Catching Up
That is what the tape has been showing.
4. Earnings Deceleration Is Not the Same as a Bear Market
The US portfolio strategy team expects S&P earnings growth to slow from:
24% this year
to 13% next year
That downshift can reduce upside convexity. But it does not imply a bear market.
The historical stat is important:
over the last 30 years, there have been 13 occurrences of double-digit earnings growth
the S&P was higher in 11 of 13
average total return was 14%
So the market can still generate positive returns even as earnings growth decelerates, as long as the growth rate remains double-digit and recession risk stays contained.
The right framing is:
Lower expected returns, not necessarily negative returns.
5. Hyperscalers: AI Capex Still Has Equity-Market Permission
The most important Tech takeaway from earnings was hyperscaler cloud revenue growth and the clearer link between AI capex and ROIC.
MSFT and AMZN helped investors connect:
AI Capex→Cloud Revenue Growth→ROIC JustificationAI Capex→Cloud Revenue Growth→ROIC Justification
As long as that linkage holds, the market is unlikely to force hyperscalers to slow spending.
That means infrastructure providers remain supported:
semis
networking
optical
data centers
power equipment
cooling
electrical infrastructure
engineering / construction
private credit / infrastructure finance
But this also leads directly to more bond issuance.
6. Credit Market: Access Is Fine, Supply Is the Issue
The expected increase in hyperscaler IG issuance is large:
issuance directly by hyperscalers expected to increase 4-fold from 2025 to 2027
There is no major concern about their access to capital. These are high-quality issuers with strong cash flows.
The issue is not credit quality.
The issue is supply digestion.
Expected issuance:
US$250bn of bonds this year
US$400bn next year
That is a lot of duration for the market to absorb, especially when combined with:
broader AI ecosystem issuance
data-center debt
private credit structures
securitized compute / infrastructure cash flows
Treasury supply
already-high real yields
This connects to the rates disconnect:
AI capex can support earnings while simultaneously pressuring real yields through sustained capital demand.
That is the main macro risk for September / October.
7. Equity Supply: Big Nominal Numbers, Manageable Denominator
US equity supply is expected to be:
US$700bn this year
including US$225bn of IPOs
Those are record nominal figures.
But the denominator matters:
US equity market cap is roughly US$80tn
US$700bn is less than 1% of total market cap
So while supply can create near-term indigestion, especially seasonally, it is not necessarily enough to derail the bull market on its own.
The key issue is timing.
Supply clustered into September / October can create chop even if the annual supply burden is manageable.
8. Hedge-Fund Positioning: Reset, Not Washed Out Completely
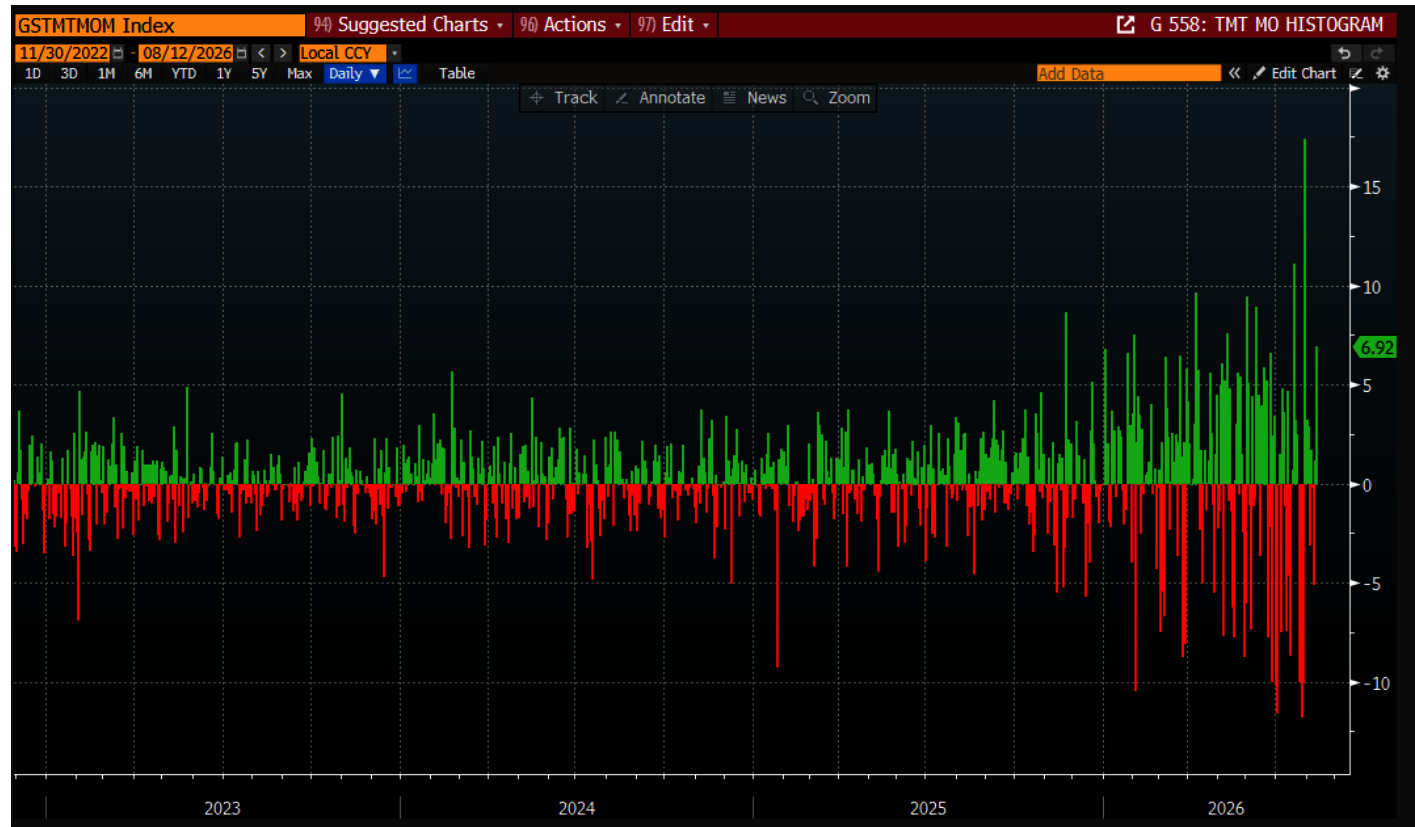
The July washout was violent:
TMT momentum factor fell 38% in 23 trading days
Current GS PB book positioning over a 1-year lookback:
Metric | Percentile |
|---|---|
Gross exposure | 43rd percentile |
Net exposure | 43rd percentile |
Momentum-factor leverage | 46th percentile |
This says positioning is not deeply bearish, but it is also no longer euphoric.
The interpretation:
Investors remain in consensus positions, but the overall risk posture is materially less aggressive than at the end of Q2.
That supports August upside because there is room to re-risk, especially if markets continue higher and vol remains contained.
9. Small Caps: Strong Year, But Punch May Fade
Small caps have had a surprisingly strong year:
Russell 2000 up roughly 23%
Drivers:
good cyclical environment
unexpected AI buildout gearing
heavy short base at the start of the year
But those drivers may be less powerful from here.
Why?
cyclical upside is more recognized
AI-linked small-cap names have rerated
some AI names have graduated out of small-cap indices
short-covering fuel is less obvious
small caps remain highly rate-sensitive
Small caps can still rally on lower yields, especially around CPI / Fed repricing, but the easy phase may have passed.
10. Europe: Stronger Than Expected
SX5E has performed about as well as the S&P this year and sits near record highs.
That is notable because Europe lacks some of the obvious US tailwinds:
less direct AI leadership
weaker structural growth
higher sensitivity to energy
TTF gas has doubled this year
Yet the rally persists.
Possible explanations:
valuation support
shareholder returns
global cyclicals exposure
financials strength
defense spending
luxury stabilization
underownership
better-than-feared earnings
Europe may not have the same upside convexity as US AI, but it has offered a surprisingly durable risk-adjusted rally.
11. Japan: Still a Structural Story
Japan continues to trade well, especially TPX, supported by:
strong earnings
shareholder reform
buyback acceleration
corporate governance change
domestic reflation
under-owned global allocation
foreign inflows
improving ROE focus
The buyback point is important:
Stock buybacks this year have already eclipsed all of last year.
That suggests the Japan equity story remains structurally supported, not just tactically momentum-driven.
Japan remains one of the cleaner non-US equity stories.
12. Gold: Technical Breakout and China Demand
Gold remains constructive.
Positive developments:
downtrend from January blowoff top has broken
50-day moving average has been recovered
China demand is picking up
PBOC official buying reaccelerated
China regular imports are surging
CTA momentum indicators have flipped positive
House view:
US$4,900 by year-end
This gives gold a role as both:
a real-yield / Fed hedge
and a policy / geopolitical / reserve-diversification asset
Gold’s setup is particularly interesting because it can work even when the equity market remains constructive, especially if the driver is China demand and central-bank diversification rather than just falling yields.
13. AI Volatility: The Fever Broke, but Base Vol Is Higher
July was a peak moment for realized volatility in the AI / TMT momentum factor.
The fever broke once enough risk was shed, but the base level of AI volatility is likely higher than before.
Reasons:
1. Technology Rate of Change Is Accelerating
The underlying tech cycle is moving fast. That means winners, losers, and relative advantages can shift quickly.
2. Financing Needs Are Growing
The buildout is increasingly capital intensive and starting to test boundaries:
hyperscaler bonds
private credit
vendor financing
data-center securitization
power infrastructure
AI-lab funding
possible IPO exits
3. US-China Competition Is Intensifying
The geopolitical dimension raises volatility around:
export controls
Nvidia China sales
domestic Chinese alternatives
Taiwan risk
sovereign AI investment
supply-chain restrictions
So the AI trade may remain strategically bullish but tactically volatile.
14. This Is the Key Market Tension
The market’s core tension into year-end is:
AI Capex Supports Earnings and BroadeningAI Capex Supports Earnings and Broadening
but also:
AI Capex Increases Financing Needs, Real Yields, and VolatilityAI Capex Increases Financing Needs, Real Yields, and Volatility
That is why August can continue higher, while September / October become choppier.
The bull market does not need to end. But the path can become less linear.
15. September / October: Why Choppier?
The expected chop has several drivers:
Supply
US$700bn equity supply this year
US$225bn IPOs
larger IG issuance
hyperscaler bonds
AI ecosystem financing
Seasonals
September / October are historically more volatile months.
Midterms
Political uncertainty can affect:
fiscal policy
tax incentives
AI policy
energy policy
China policy
regulation
IPO timing
capital-market confidence
Rates
If AI capex continues pushing real yields higher, equity multiples may face pressure.
AI Vol
Higher base volatility in AI leadership can spill into index volatility.
16. Year-End Push Setup
The choppiness can set up a final push into year-end if:
earnings revisions remain stable
September hike risk continues to fade
credit markets absorb supply
AI capex remains linked to ROIC
hyperscaler demand stays intact
Nvidia validates the AI infrastructure thesis
buybacks resume after blackout windows
systematic flows remain supportive
seasonals turn favorable
The path would be:
August Rally→Sept/Oct Chop→Year-End PushAugust Rally→Sept/Oct Chop→Year-End Push
That is a plausible roadmap.
17. Practical Tactical Expression
Near Term: August
Favor:
S&P upside / breakout exposure
QQQ call spreads to end-August
quality cyclicals
industrials / power / electrical equipment
profitable AI infrastructure
Japan
gold
Be more cautious on:
crowded high-beta AI
stretched small caps
weak balance-sheet AI beneficiaries
levered data-center models
Sept / Oct
Expect:
more two-way volatility
supply digestion
more sensitivity to rates
political headline risk
AI funding scrutiny
wider dispersion
Use:
hedges when vol is cheap
defined-risk structures
relative value
quality bias
cash for dislocations
Year-End
If chop clears without earnings damage:
re-add beta
buy AI leaders / infrastructure after resets
add cyclicals
participate in Santa / year-end flows
lean into buybacks and cleaner positioning
I’m staying with the view that the path of least resistance for the S&P is higher in August, followed by choppier September / October trading on supply, seasonals, and midterm risk, before a final push into year-end. The key support is earnings breadth: 9 of 11 sectors delivered double-digit EPS growth, median stock earnings growth is 14%, every sector is positive YTD, and equal-weight S&P is up 16%. This is broadening by catch-up, not catch-down, because Tech remains the second-best sector YTD at +23%. Positioning has reset after the July TMT momentum unwind, with gross, net, and momentum exposure all around the mid-40th percentiles. The AI capex cycle remains supportive as hyperscalers link spend to ROIC, but it also introduces the main risk: rising bond issuance, real-yield pressure, and higher base volatility. That combination argues for August upside, September / October chop, and a year-end rally if earnings and credit remain resilient.
Tony Pasquariello Goldman Sachs - Markets and Macro
Disclaimer: The material provided is for information purposes only and should not be considered as investment advice. The views, information, or opinions expressed in the text belong solely to the author, and not to the author’s employer, organization, committee or other group or individual or company.
Past performance is not indicative of future results.
High Risk Warning: CFDs are complex instruments and come with a high risk of losing money rapidly due to leverage. 69% and 73% of retail investor accounts lose money when trading CFDs with Tickmill UK Ltd and Tickmill Europe Ltd respectively. You should consider whether you understand how CFDs work and whether you can afford to take the high risk of losing your money.
Futures and Options: Trading futures and options on margin carries a high degree of risk and may result in losses exceeding your initial investment. These products are not suitable for all investors. Ensure you fully understand the risks and take appropriate care to manage your risk.
Patrick has been involved in the financial markets for well over a decade as a self-educated professional trader and money manager. Flitting between the roles of market commentator, analyst and mentor, Patrick has improved the technical skills and psychological stance of literally hundreds of traders – coaching them to become savvy market operators!